Optimize Python Using cProfile
Profiler is used to analyze the running time of the program, and be helpful to figure out the blocks which are slowing down the entire project. Especially when the project becomes large, there is no better way than using the profiler to optimize the program.
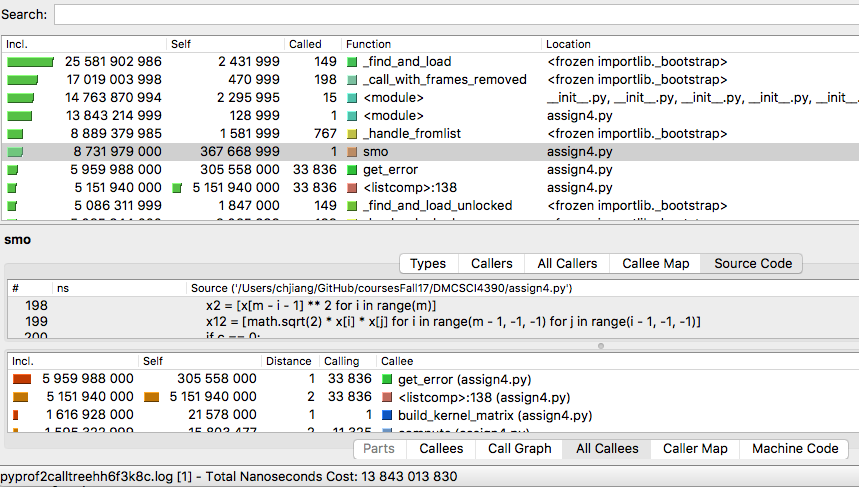
There are several popular profilers, but I recommend cProfile - a C module providing enough features and data. The profiler collect all related stats of the program, including the function called, the time spent on each function, the times each function is called.
However, it’s not easy to directly read the collected raw data without any preprocessing or organization. The profiler
provides ways to sort the collected data. There are more advanced visualization tools, e.g. KCacheGrind. It reports the
collected data with an iterative calling graph sorting functions in decreasing order in terms of running time, times
of being invoked. To use it, we can install it via conda:
$ conda install -c anaconda qcachegrind
To profile the program, e.g. machlearn.py, there are at most two steps:
- collecting running data
$ python -m cProfile -o machlearn.cprof machlearn.py
- visualizing the data
$ pyprof2calltree -k -i machlearn.cprof